
District-by-District Test Scores Echo a Decade of Decline in U.S. Math and Reading
TL;DR
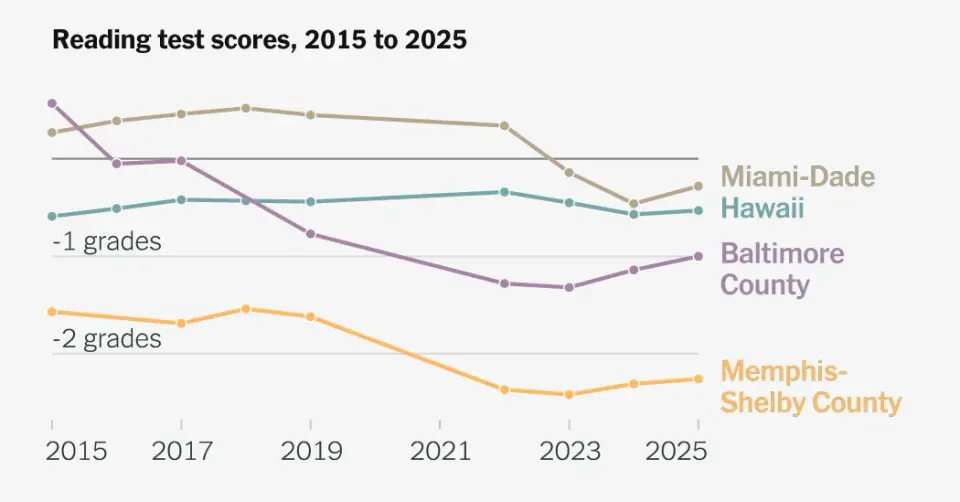
Stanford's Educational Opportunity Project, linked with NAEP, shows third- to eighth-grade math and reading scores have declined over the past decade. The Times provides a district-by-district lookup for changes since 2015, with exclusions for states and districts lacking data (e.g., New York); where 2015 data are missing, baseline scores come from the 2014–2016 average to enable cross-district comparisons.
- Look Up Your School District’s Test Scores The New York Times
- U.S. students' "reading recession" continuing but some places bucking the trend CBS News
- Reading, math scores are sliding nationwide. These Pa. school districts are bucking the trend 90.5 WESA
- Kids' test scores began declining way before COVID. These schools are making gains NPR
- New Education Scorecard Finds "U-Shaped Recovery": High- and Low-Income Districts Improve Most Since 2022, While Middle-Income Districts (30-70% Federally Subsidized Lunches) Lag Yahoo Finance
Want the full story? Read the original reporting
Read on The New York Times