
Historical Data Suggests S&P 500 Enters Strongest Midterm Window
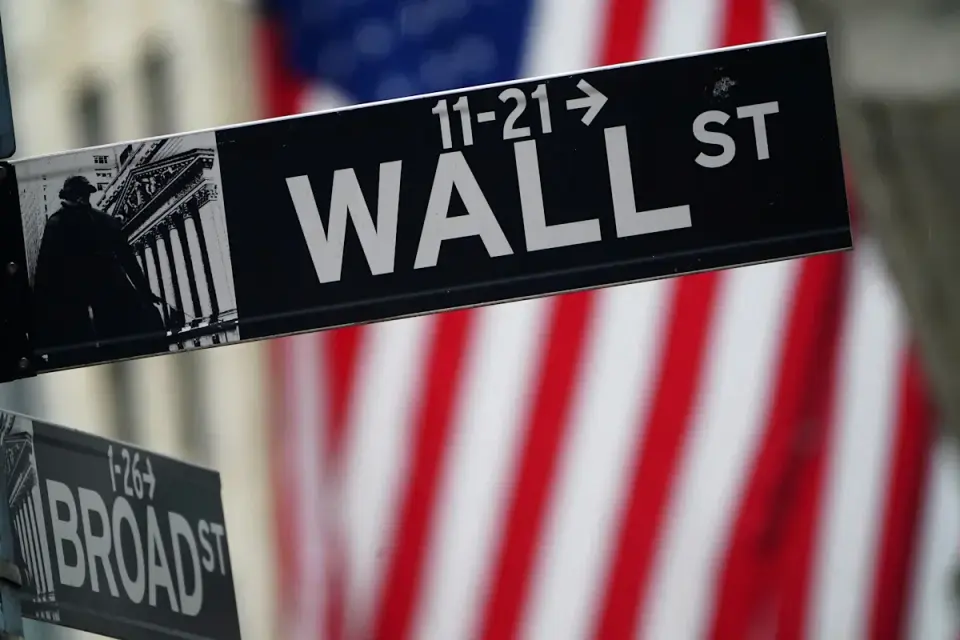
Historical data indicates the S&P 500 typically rises in the eight trading sessions surrounding midterm elections. This year’s window, starting October 27, coincides with major corporate earnings and a Federal Reserve decision. While long-term trends favor bulls, some analysts warn that current economic conditions may disrupt historical patterns.
Key points
- The S&P 500 has risen in 18 of 19 midterm years from five sessions before Election Day to three sessions after, with a median gain of nearly 3%.
- This year’s favorable window opens at the close of October 27 and runs through November 6, a week before the November 3 vote.
- The period includes a Federal Reserve decision, earnings from Microsoft and Alphabet, and the October jobs report.
- The index is currently about 2% below its October 6 record high.
- CFRA’s Sam Stovall notes that stocks have never fallen in the 12 months following October 31 of a midterm year.
- Jim Paulsen cautions that higher oil prices and bond yields may lead to disappointment despite historical trends.
Background
Recent coverage highlights a challenging political landscape for the administration, with approval ratings below 33% and internal White House turmoil. National polls show Democrats leading the generic ballot, driven by dissatisfaction with the cost of living and high energy prices linked to the US-Iran conflict. These political and economic tensions provide the backdrop for the upcoming market volatility.
How outlets are covering it
Yahoo Finance emphasizes the statistical strength of the upcoming eight-session window, noting it is the best stretch of a midterm year historically. Seeking Alpha’s Luca Socci agrees, highlighting an 18-for-18 record of the S&P 500 being higher 12 months after Election Day since 1954, and suggests positioning for gains between November and April. However, Jim Paulsen offers a contrarian view, arguing that tighter financial conditions, including higher oil prices and bond yields, could undermine the usual rally. While Yahoo Finance focuses on the immediate pre-election window, Seeking Alpha looks at the broader post-election trend, and Paulsen questions whether current macroeconomic factors will override historical patterns.
Why it matters
Investors are navigating a critical period where historical market behavior suggests upward momentum, but current economic headwinds and political uncertainty create risk. The convergence of major earnings reports and a Federal Reserve decision during this historically favorable window could significantly influence market direction in the coming months.
What to watch
Market participants will watch the Federal Reserve’s decision, Microsoft and Alphabet earnings, and the October jobs report for signals. The performance of the S&P 500 in the eight sessions leading up to and following the November 3 election will test the historical pattern. Analysts will also monitor whether the 12-month post-midterm trend holds despite current economic pressures.
- Stocks' best stretch of a midterm year starts today, a week before Election Day Yahoo Finance
- This Midterm’s Stock-Market Pattern Hasn’t Failed Since 1950, and It Kicks Off This Week Yahoo Finance
- A bigger-than-expected win for Democrats in the midterms could deliver ‘short-lived weakness’ for stocks, strategists say MarketWatch
- A Democrat Midterm Win Is Seen Heralding a Bond Rally: Markets Pulse Bloomberg.com
- This Week I Am Going Shopping With History On My Side (NYSEARCA:XLK) Seeking Alpha
Want the full story? Read the original reporting
Read on Yahoo Finance