
S&P 500 breadth hits dot-com lows as mega-cap rally masks broad market weakness
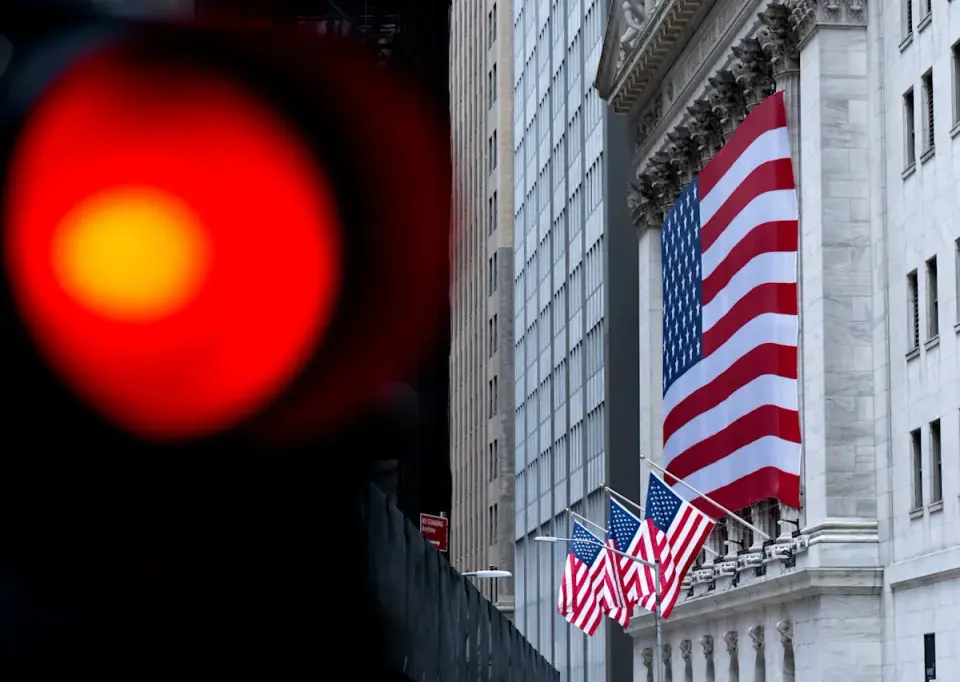
The S&P 500 is trading within 2% of its all-time high, but market breadth has deteriorated to levels not seen since the dot-com era. Fewer than 25% of index stocks are above their 50-day moving averages, and fewer than 45% are above their 200-day moving averages. This divergence suggests the current rally is driven by a narrow group of mega-cap technology firms, masking underlying weakness in the broader market.
Key points
- Ned Davis Research identifies a rare divergence where the S&P 500 is near record highs, but fewer than 25% of stocks are above their 50-day moving averages and fewer than 45% are above their 200-day moving averages.
- This specific combination of conditions has occurred only six times since 1980, often preceding bull market peaks, such as in September 2014 and November 2021.
- Historically, such breadth divergences have signaled a downward bias for the S&P 500 over the following month, with market peaks typically occurring around five months later.
- HSBC strategists describe the situation as 'severe damage under the hood,' noting that the rally is sustained by a narrow group of mega-cap technology and AI infrastructure firms.
- The S&P 500 has returned 14% this year, but the median stock in the index trades 16% below its 52-week high, highlighting the extreme concentration of gains.
Background
This development follows a week of similar warnings from other analysts. On September 24, 2026, MarketWatch and CNBC reported that 52% of S&P 500 members were trading below their 200-day moving averages, a level of narrowness not seen since the dot-com peak. BTIG's Jonathan Krinsky also cited '2000-like signals' due to widening dispersion in the Philadelphia Semiconductor Index. More recently, on September 28, 2026, Goldman Sachs reported that 45% of S&P 500 stocks had a negative three-month beta, another dot-com-era level of divergence. These reports confirm a persistent theme of extreme market concentration driven by mega-cap technology and AI infrastructure firms, which are masking weakness in the broader market.
How outlets are covering it
Ned Davis Research and HSBC both emphasize the severe divergence between the S&P 500's performance and market breadth, viewing it as a bearish near-term signal. NDR's Ed Clissold and Thanh Nguyen state that 'the vast majority of market tops are preceded by breadth divergences' and that 'mega-caps are masking trouble under the surface.' HSBC strategists similarly describe the trend as 'severe damage under the hood.' Both firms agree that the current rally is unsustainable and driven by a narrow group of stocks. However, NDR notes that they are 'giving the bulls the benefit of the doubt for now,' suggesting that a reduction in equity exposure would be prudent if the divergences do not clear on any year-end rallies. This indicates a cautious but not yet definitive bearish stance, acknowledging the possibility of a short-term rally before a broader market peak.
Why it matters
The current divergence between the S&P 500's performance and market breadth is a significant warning sign for investors. It suggests that the current rally is driven by a narrow group of mega-cap technology and AI infrastructure firms, which are masking underlying weakness in the broader market. Historically, such divergences have preceded bull market peaks, often leading to a downward bias for the S&P 500 over the following month and market peaks around five months later. This indicates that the current rally may be unsustainable and that a broader market correction could be imminent. Investors should be cautious and consider reducing equity exposure if the divergences do not clear on any year-end rallies.
What to watch
Investors should monitor market breadth closely in the coming weeks and months. If the divergences do not clear on any year-end rallies, a reduction in equity exposure on expectations of a topping process would be the prudent course of action, according to Ned Davis Research. Investors should also watch for signs of a broader market correction, such as a decline in the number of stocks trading above their 50-day and 200-day moving averages. Additionally, investors should consider diversifying their portfolios to include sectors and stocks that are not part of the current mega-cap technology and AI infrastructure rally, such as dividend-growth stocks, energy, and telecoms, which have been outperforming the S&P 500 in 2026.
- S&P 500 alarm bells are starting to go off Yahoo Finance
- A rare signal is flashing in the market that suggests the bull rally in stocks is about to peak Business Insider
- Don’t Let the S&P 500 Fool You: Stocks Are in a Stealth Bear Market Barron's
- The stock market is anything but normal right now — and these charts show it MarketWatch
- 4 Signs Of A Bear Market, And Why I Am Still Fully Invested Seeking Alpha
Want the full story? Read the original reporting
Read on Yahoo Finance