
Top Data Visualizations and Graphics of 2025
TL;DR
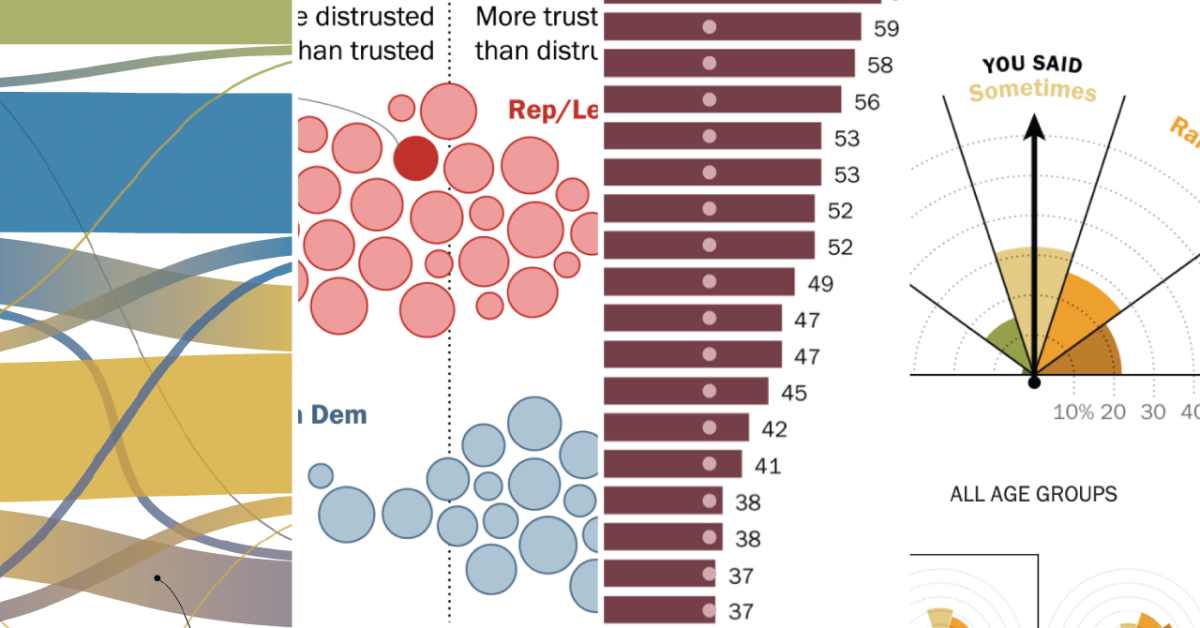
Pew Research Center's 2025 data visualizations showcase innovative techniques like alluvial diagrams, annotated charts, and nature-inspired visuals to effectively communicate research findings on topics such as political shifts, social norms, and global demographics, emphasizing clarity, engagement, and storytelling across digital platforms.
Topics:businesstechnology#alluvial-diagrams#data-visualization#interactive-graphics#research-communication#technology#visual-storytelling
- Our favorite data visualizations of 2025 Pew Research Center
- 2025: The Year in Graphics, Data, Maps, and Visual Stories Bloomberg.com
Want the full story? Read the original reporting
Read on Pew Research Center