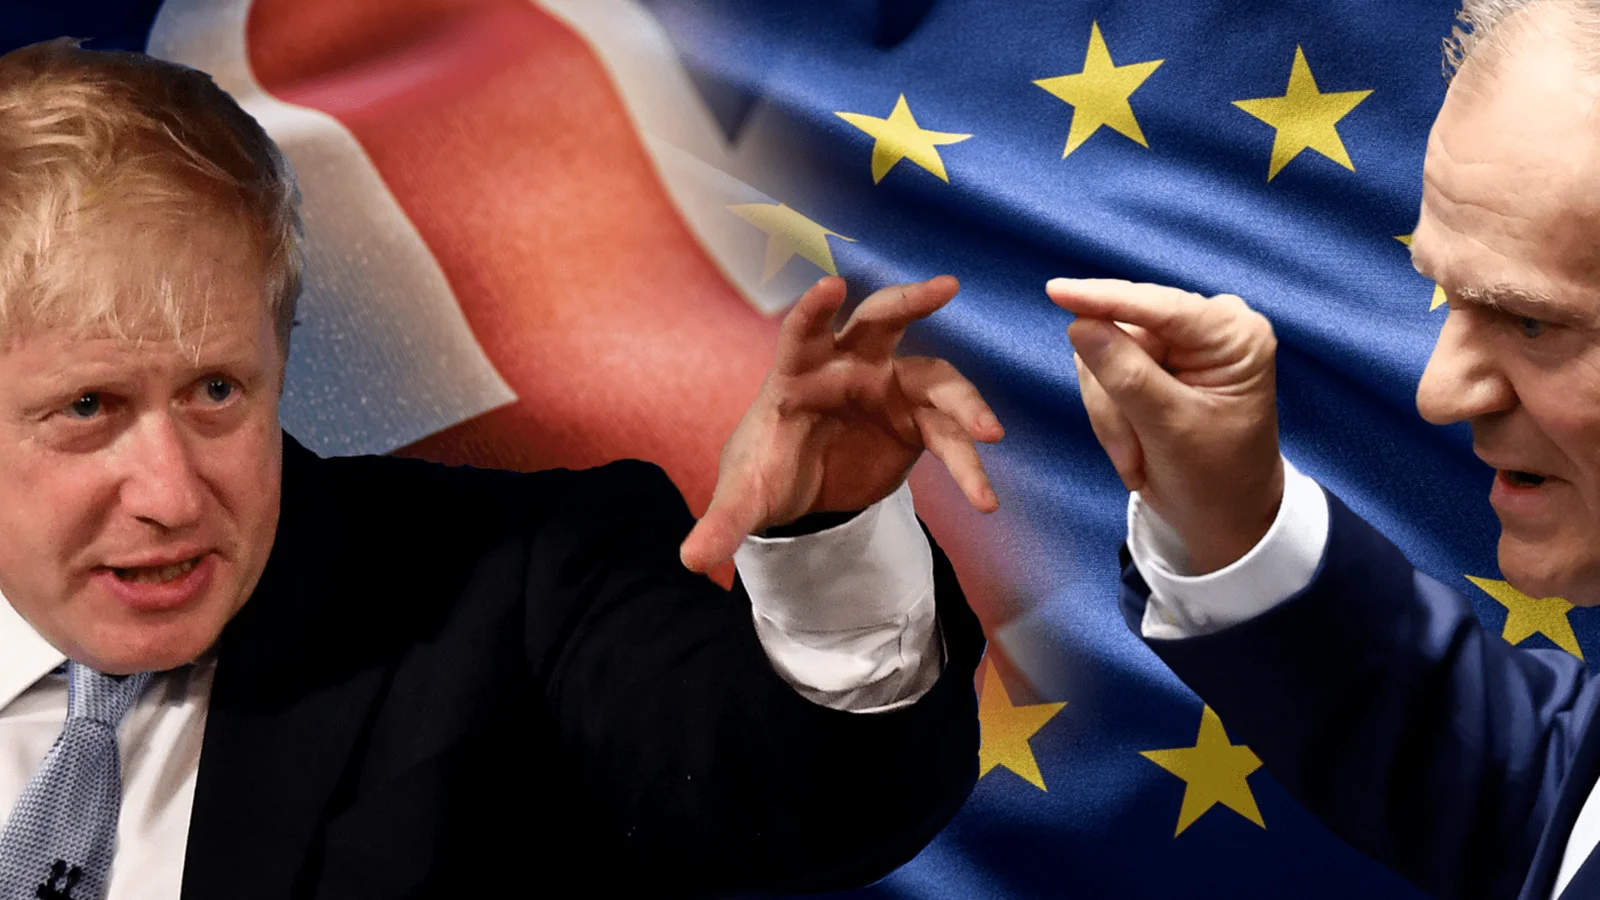
Ten Years After Brexit: charts map Britain’s bumpy economy and politics
TL;DR Summary
Brexit’s decade has yielded little growth payoff: GDP is estimated to be 6-8% lower by 2025 due to uncertainty and misallocation; EU net migration turned negative in 2022 while non-EU migration rose to fill gaps; the pound remains about 10% weaker than its 2016 level, raising import costs; the FTSE-100 has lagged the FTSE-250 and US stocks; the EU remains the UK’s largest trading partner with tariff-free trade secured by a 2021 deal; prime ministers have changed frequently, highlighting political churn.
- Brexit 10 years later: How the UK economy and politics changed, in charts CNBC
- Opinion | 10 Years After Brexit, the Dismal Verdict Is In The New York Times
- Britain left the EU 10 years ago. Its politics has been an unruly mess NPR
- ‘I feel entirely vindicated’: three Guardian columnists debate Brexit and its legacy The Guardian
- Ten years on, Britain counts the cost of Brexit CNN
Reading Insights
Total Reads
0
Unique Readers
4
Time Saved
4 min
vs 5 min read
Condensed
91%
874 → 81 words
Want the full story? Read the original article
Read on CNBC