Nvidia at a make-or-break price point, traders await next move
Nvidia stock is hovering near a crucial price level that could determine its near-term direction, with traders watching for a breakout or reversal as they gauge the next move.
All articles tagged with #technical analysis

Nvidia stock is hovering near a crucial price level that could determine its near-term direction, with traders watching for a breakout or reversal as they gauge the next move.

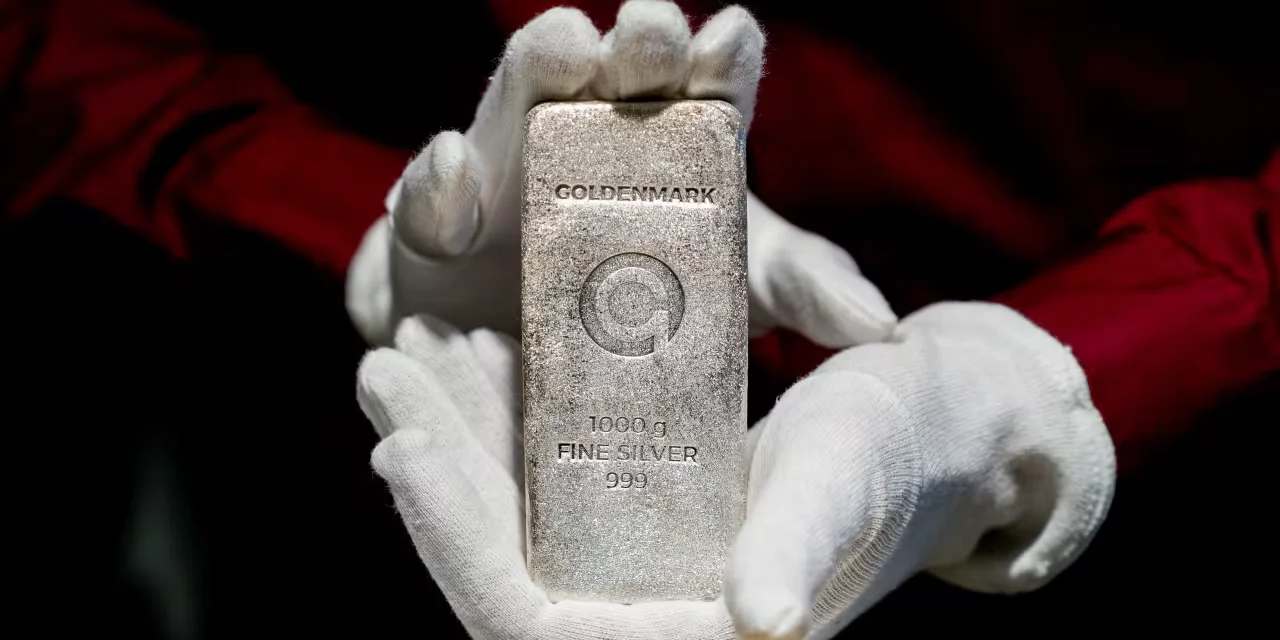
Barron's technical analysis suggests silver could bottom around $60, with an entry near $61, before a potential rally toward $97.40 later in the year. The view comes after a drop from the mid-$80s to the mid-$60s and a 10-month monthly uptrend, with bearish RSI signals and high volatility keeping risk in check. If investors have conviction, volatility may present an entry point, per the analysis.

The S&P 500 fell to fresh 2026 lows with volatile bounces; while more downside looks possible, the index now approaches the 200-day moving average which may trigger a tentative bounce, and equities remain underweight amid geopolitical headwinds, with a potential bullish alignment possible in early April if technical signals cooperate.

Bitcoin faces renewed downside pressure as Michael Purves of Tallbacken Capital Advisors doubles down on a $45,000 target after fresh bearish signals: a sequence of MACD sell signals and the completion of a head-and-shoulders pattern with a neckline near $76,000, a break beneath which could trigger forced deleveraging. The $76k neckline also aligns with the strategy’s average cost of acquisition, underscoring the risk of further downside as the crypto slides to its weakest levels in months.

Bitcoin trades around the mid-$70k zone as momentum weakens; analysts warn that breaking below the crucial $74,000 support could unleash a deeper pullback (possibly toward the $60k–$70k range), with any relief likely only if prices reclaim around $80,000, as macro uncertainty and leveraged positioning continue to weigh on the market.

Silver remains in a bullish uptrend, trading near $107.50 as it tests the $109.50–$110 resistance. A sustained break above $110 could open the path to $113.50 and toward the upper channel around $118.40, with key support at $103.30 and the lower bounds near $97.80–$98. If prices slip below $104.90, deeper consolidation toward $102.20 or $99.90 could occur, though the overall trend stays constructive unless $97.80 gives way, supported by a weaker dollar, easing real yields, and geopolitical uncertainty.

An industrial stock rose to a fresh 52-week high and now appears overbought, suggesting traders should be cautious for a potential near-term pullback or momentum shift.

Bitcoin dropped below $100,000, triggering extreme fear among traders and leading to significant liquidations, with technical and macroeconomic factors contributing to the decline. Despite the volatility, some analysts remain optimistic about a long-term recovery, citing strong fundamentals and future rate cuts.

Bitcoin has fallen below its 200-day moving average at $109,800, signaling potential further downside to around $94,200, but its long-term momentum remains positive with a possible target of $134,500 if the trend continues.

XRP's price holds above key levels in September, with potential for a 30% rally if it breaks above $2.81, but October has historically been a challenging month for XRP. The upcoming ETF decisions and historical seasonal trends suggest possible bullish movements in Q4, especially if key resistance levels are surpassed. However, caution is advised due to historical October struggles and potential short-term supply walls.

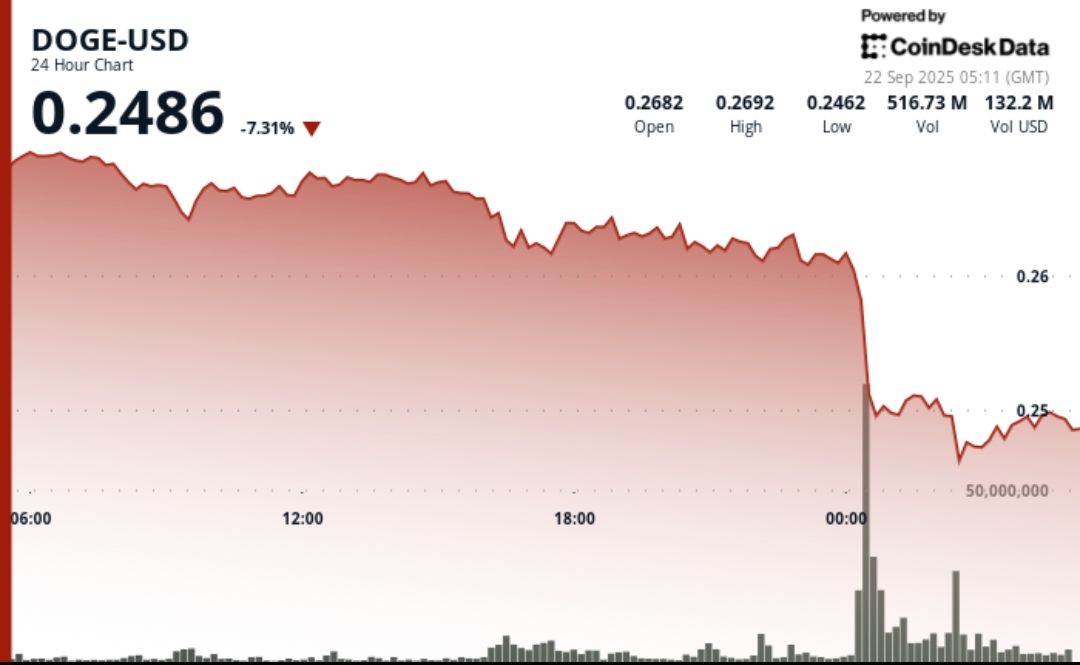
Dogecoin experienced a sharp decline from $0.27 to $0.25 amid record trading volumes, with technical patterns suggesting a potential breakout above $0.28–$0.30 if buying resumes. Traders are watching support at $0.25 and resistance at $0.27, amid broader market uncertainties and institutional activity.

Dogecoin has broken out of a multimonth symmetrical triangle, with a 40% weekly gain and tripled trading volumes, signaling strong bullish momentum. The breakout target is around $0.60, representing a potential 95% increase, supported by technical patterns and on-chain metrics suggesting further growth in the coming weeks. However, support levels at $0.227 and $0.215 are crucial to maintain the bullish setup, and current market conditions indicate room for additional gains.

UnitedHealth Group's stock is showing bullish technical signals, including a breakout above $315 and a potential move to $380, indicating a possible upward trend. Peer healthcare stocks like Cigna and Humana are also displaying positive patterns, with Cigna approaching a breakout above $308 and Humana experiencing a trend reversal with a seven-week winning streak, suggesting continued strength in the healthcare sector.

Palantir's stock and the broader software sector are experiencing significant declines, with technical breakdowns suggesting further downside potential. The iShares Expanded Tech-Software Sector ETF and key stocks like Palantir and Intuit are showing signs of weakness, though some infrastructure stocks like Synopsis demonstrate resilience. Investors are advised to play defense until the technical picture improves.

Small-cap stocks are approaching their first 'golden cross' in 18 months, a bullish technical indicator that historically precedes gains, amid a broader market rally that favors cyclicals and small caps over megacap tech stocks. However, underlying fundamentals remain uncertain, with experts cautioning that the rally may be temporary due to economic headwinds and high interest rates.