A GNSS-based study (1997–2015) finds the poles rising while the equator sinks due to ice melt and mass redistribution, so the solid Earth is becoming less flattened even as the geoid grows more flattened.
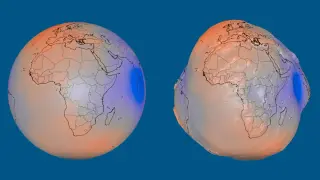
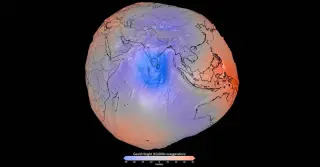
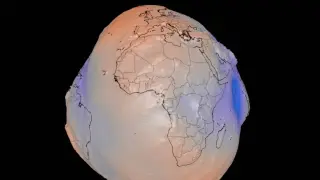
NASA released a visualization of the geoid—the imaginary sea level defined by gravity and Earth's rotation—showing Earth as a potato‑like shape caused by uneven mass distribution. The geoid is not the planet's physical surface; the display exaggerates height variations 10,000× to illustrate how gravity varies across the globe. Real differences reach about 85 meters above the reference near Iceland and 106 meters below it south of India, with a total range around 191 meters. The visualization combines more than a billion observations from 19 satellites over 15 years (e.g., GRACE and GOCE) and helps researchers study gravity changes for mapping, surveying, and navigation.
NASA's high-precision geoid map reveals subtle gravity highs and lows across Earth; the potato-like visualization is a magnified representation and does not show the planet's actual shape. The geoid model improves GPS accuracy, sea-level monitoring, and understanding Earth's interior, built from GOCE and GRACE data over 15 years, with notable gravity highs near Iceland and lows south of India.
NASA released a gravity-based geoid visualization showing how the ocean surface would look under gravity alone (tidal and wind effects removed). Exaggerating gravity differences 10,000× highlights irregularities caused by dense interior regions, with the geoid peaking near Iceland (about 279 feet above the global average) and dipping south of India (about 348 feet below). Derived from over a billion measurements from the GOCE and GRACE satellites across ~15 years, the highly detailed geoid is not Earth’s physical shape but a tool to improve navigation, topographic surveys, and our understanding of the planet’s interior.
Scientists modeling Earth’s interior propose a long-lived, hot, low-density mantle upwelling originating beneath Africa drifts east beneath the Indian Ocean, reducing local mass and producing the observed geoid low. The idea, supported by 100-million-year simulations and the Indian plate’s motion, explains why satellite data show a persistent dip in the sea surface, though the interpretation is still debated.
Researchers reconstructed the Antarctic geoid low over ~70 million years, showing a persistent gravity valley shaped by deep mantle flow and evolving upper-mantle buoyancy. A major change in amplitude and position occurred between 50 and 30 million years ago, linked to long‑term subduction and upwelling, with a possible connection to true polar wander and Antarctica’s ice-sheet history. The study cautions that while deep-Earth dynamics can reshape the gravity field, translating this into climate or ice-sheet impacts requires further work.
Scientists have used supercomputers to simulate the formation of the "gravity hole" in the Indian Ocean, a depression that experiences less gravity than the rest of the planet. The study suggests that the cause of the gravity hole is likely due to plumes of magma under the Earth's crust, formed by the drifting and collision of India's subcontinent with Asia 40 million years ago. The researchers ran simulations dating back 140 million years, with six of them leading to the formation of the gravity hole. However, some experts argue that the study fails to account for certain factors and that the simulated geoid differs from Earth's real surface shape.
Scientists have discovered a "gravity hole" in the Indian Ocean, where the pull of gravity is lower than average, resulting in a lower sea level. This phenomenon is likely caused by magma plumes that have been flowing for the past 20 million years. The researchers believe that when these plumes eventually stop, the gravity hole will dissipate. This finding provides valuable insights into Earth's geoid and gravitational variations.