Tag

Dot Plot

All articles tagged with #dot plot

Fed Hike Signals Bond Market Turbulence as 10-Year Yield May Break 6%
finance22 days ago

Fed Hike Signals Bond Market Turbulence as 10-Year Yield May Break 6%

Yahoo Finance reports that after the Fed’s rate hike, Kobeissi Letter strategists estimate the 10-year U.S. Treasury yield could rise about 50 basis points in the first six months of tightening and around 110 bps over the next year, potentially pushing the yield above 6% next year—the first time since 2000. In extreme scenarios yields could climb by as much as 400 bps. Treasury interventions may persist but have failed to prevent the move as yields recently surpassed 5%. The development comes amid sticky inflation, higher energy costs, and the Fed’s updated projections, with the dot plot not ruling out another hike this year. Markets warn of a disorderly bond sell-off even as some fund managers trim equity exposure, though Goldman Sachs cautions the tightening cycle may be only starting.

Fed poised for 25bp hike as dot-plot takes center stage
economy23 days ago

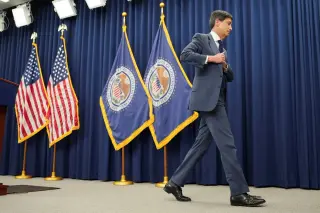
Fed poised for 25bp hike as dot-plot takes center stage

Markets broadly expect the Federal Reserve to raise its policy rate by 25 basis points to 3.75%–4.00%, with rate futures pricing in roughly a 90% chance of the move. The key signal will come from the Fed’s dot plot and Chair Warsh’s post-decision remarks, which could point to further hikes or a near-term pause. A hawkish dot plot would push long-term yields higher and TLT lower, while signals of a pause could bring relief. Economists from Citi and other firms have seen a hike as likely, with some forecasting two moves, highlighting that Warsh’s guidance will be crucial given the committee’s divisions.

Fed dot plot hints at rate hikes this year as policy shifts under Warsh
economy3 months ago

Fed dot plot hints at rate hikes this year as policy shifts under Warsh

The Fed’s latest dot plot shows a notable shift: nine of the 18 participating FOMC members expect at least one rate hike this year, with six predicting multiple hikes, while the other nine foresee no change or a cut by year-end 2026. The median estimate for the end of 2027 remains 3.50%–3.75%. This contrasts with March’s projection of a 2026 cut and two cuts by 2027. New Fed Chair Kevin Warsh did not participate in the dot plot and has signaled a move away from forward guidance, including a potential discontinuation of the dot plot as part of a broader communications review.

Warsh Signals Quiet Overhaul of Fed Communication
economy3 months ago

Warsh Signals Quiet Overhaul of Fed Communication

New Federal Reserve chair Kevin Warsh signals a major shift in how the Fed communicates, aiming to reduce the emphasis on forward guidance and avoid policy errors caused by market overreliance on Fed signals. He advocates cutting back on frequent public remarks, potentially returning to a less frequent press-conference schedule, and removing or limiting the easing bias in policy statements while rethinking the dot plot and forecast process. The changes would be gradual and contested: supporters warn that less communication could increase market volatility or reduce clarity, while Warsh argues that more thoughtful, deliberative decision-making—not rapid talking points—will improve policy. Despite initial steps like a press conference after meetings, Warsh has not committed to maintaining frequent public comments, and regional Fed presidents retain independent voices, making a smoother transition likely over time.

Warsh Era Could Redefine Fed Policy, Markets Brace for Change
economy5 months ago

Warsh Era Could Redefine Fed Policy, Markets Brace for Change

The article flags a potential shift in U.S. monetary policy if Kevin Warsh replaces Jay Powell, signaling an end to forward guidance and the quarterly dot plot; Warsh would push for a smaller Fed balance sheet and view QE as fiscal policy, relying on rate policy to influence the economy. It also suggests adopting the trimmed-mean PCE as the inflation gauge could justify earlier rate cuts, affecting yield curves and volatility. However, funding-market stability may cap how much policy tools are changed.

Fed's Dot Plot Indicates Cautious Rate Cuts and Economic Optimism
finance1 year ago

Fed's Dot Plot Indicates Cautious Rate Cuts and Economic Optimism

The dot plot is a quarterly scatter chart used by the Federal Reserve to project future interest rates, reflecting the views of FOMC members on the appropriate federal funds rate over the coming years. While it provides insight into policymakers' expectations and can influence market perceptions, it is not an official consensus forecast and lacks transparency about individual contributions, leading to mixed opinions among Fed leaders and critics.

Unpredictable Fed: Navigating the Mismatch Between Expectations and Reality
finance2 years ago

Unpredictable Fed: Navigating the Mismatch Between Expectations and Reality

The Federal Reserve's interest rate projections, known as the dot plot, have historically been inaccurate when predicting rates beyond a three-month period, according to an analysis by Glenmede Investment Management. The dot plot has been most accurate in predicting rates for the same year but less reliable for the following year and significantly off when looking two years ahead. The market reacted to the Fed's dovish policy update with a drop in Treasury yields and a surge in stock indexes. However, experts caution that there are still uncertainties and potential disruptions that could impact interest rates, such as oil prices. The market may be pricing in more rate cuts than the Fed is indicating, and the future path of interest rates remains uncertain.

Fed Meeting: Anticipated Actions and Impact on Gold Prices
finance3 years ago

Fed Meeting: Anticipated Actions and Impact on Gold Prices

The Federal Reserve's upcoming meeting is expected to focus on the central bank's future plans rather than immediate policy changes. It is highly unlikely that the Fed will raise its benchmark borrowing rate at this meeting. However, the meeting will provide updates on key indicators such as interest rates, GDP, inflation, and unemployment. Market participants will closely watch the dot plot, which reveals individual members' rate expectations, for any shifts in sentiment. The Fed's Summary of Economic Projections (SEP) is also anticipated to show an upgrade in GDP growth projections for this year, along with reductions in inflation and unemployment outlooks. Potential tweaks in the post-meeting statement and Chairman Jerome Powell's press conference could provide further insights into the Fed's stance on future rate hikes.

finance3 years ago

"Fed's Rate Projections Deemed 'Meaningless' as Gold Price Set to Rally After FOMC"

Analysts are bullish on gold, forecasting it to rise above $2,000 an ounce on a sustained basis despite the Federal Reserve's hawkish warning of two more rate hikes. Some analysts have criticized the Fed's dot plot projections, noting that these assumptions are often unreliable. As more data confirms a slowdown in the U.S. economy, it will become clearer that the Fed can't afford to raise rates further, and gold will resume its rally. The levels gold investors need to watch on the downside are $1,935, $1,900, and $1,890 an ounce.