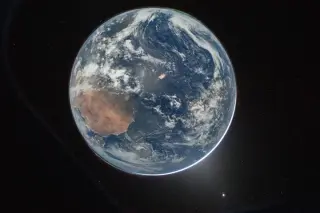
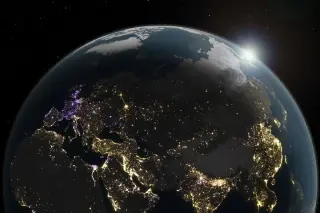
Astronauts aboard Artemis II captured a full-disk image of Earth lit by moonlight from the Orion spacecraft, revealing city lights, green auroras, and the zodiacal light, illustrating Earth as a dynamic solar-system body and highlighting how nighttime phenomena are studied from space.
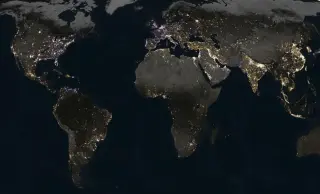
NASA’s satellite images reveal significant shifts in Earth's nighttime illumination, with rapid increases in lighting in growing urban centers across developing regions, signaling accelerating urbanization and energy use; the nighttime glow provides a new metric for tracking population trends and development over time.
NASA’s Black Marble/VIIRS data (2014–2022) show global nighttime radiance rising 34% but with bidirectional changes: some regions brighten while others dim due to urban growth, energy use, and policy shifts. In the US, the West Coast brightened while the East Coast dimmed from LED adoption and economic restructuring; Europe also dimmed notably during the 2022 energy crisis (Paris region ~33%, UK ~22%, Netherlands ~21%). NASA’s visualizations map these patterns, highlighting how human activity and policy shape the planet’s nocturnal landscape.
NASA’s Night Lights (Black Marble) maps show a nuanced 2014–2022 view: global radiance rose about 34%, but increases and decreases occur in tandem. U.S. West Coast areas brightened with growth, while parts of the East Coast dimmed as LEDs and energy shifts took hold. Internationally, China and northern India saw brightening, while Paris (33%), the UK (22%), and the Netherlands (21%) dimmed due to energy-efficiency measures; Europe’s 2022 dimming followed the Russia-Ukraine energy crisis. The data come from VIIRS sensors on Suomi-NPP, NOAA-20, and NOAA-21, and the findings were published in Nature (April 2026) with downloadable maps and animations available from NASA Earth Observatory.
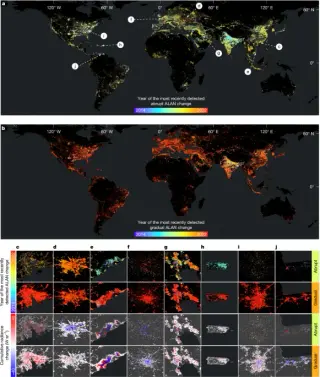
A global analysis using daily NASA Black Marble night-time lights and continuous change detection (2014–2022) shows that artificial illumination is highly volatile, with locations undergoing multiple abrupt or gradual changes. The study finds 2.05 million km2 of abrupt ALAN changes and 19.04 million km2 of gradual changes, totaling far more area affected by changes than previously thought. Net radiance rose about 16% since 2014, driven by brightening (34% of the 2014 baseline) that outpaced dimming (−18%). Regions experience both directions of change, driven by factors such as urban expansion, rural electrification, gas-flaring reductions, and energy access disruptions. Asia (notably China and India) accounts for the largest cumulative change, Europe shows pronounced dimming linked to regulations, and some regions (e.g., Venezuela) dim due to economic collapse. The work challenges the view that night-time lights only steadily intensify and highlights the need to consider bidirectional, high-frequency dynamics for policy, energy transitions, and ecological implications. Open datasets and code accompany the work for global ALAN change mapping and analysis.
Scientists are using nighttime satellite data to track industrial activity in the Arctic, revealing a 5% annual increase in brightness from 1992 to 2013, largely due to extractive industries like oil and gas. The study highlights significant growth in regions like Russia's Khanty-Mansi, while also noting fluctuations due to the lifecycle of these industries. This research aims to improve resource management and protect ecosystems by providing real-time insights into human activity in the rapidly warming Arctic.