Despite recent gains under President Trump, the piece argues that record-high CAPE valuations and an energy disruption tied to Iran heighten the risk of a meaningful stock-market pullback during his presidency.
Former Fed Chair Jerome Powell’s final remarks included a six-word warning on stock valuations—'equity prices are fairly highly valued'—a message that could reverberate through Wall Street for years as the CAPE ratio sits at a historically elevated level, a setup historians note has preceded notable market pullbacks.
Greg Abel continued Berkshire Hathaway’s pattern of net stock selling in Q1 2026 despite a record $397 billion cash hoard, while the S&P 500’s CAPE ratio above 40 signals rich valuations and potential weaker returns ahead. The piece argues that investors should favor high-conviction, quality stocks over momentum plays, as Berkshire’s actions suggest limited near-term opportunities for outsized moves, though AI could lift earnings and offset some valuation concerns.
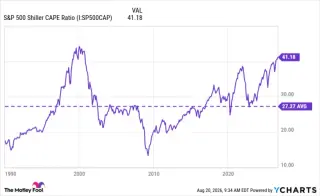
The Motley Fool argues the Trump-era bull market, while strong, is likely to end sooner rather than later, citing more than 150 years of precedent and a current CAPE ratio around 40—the second-highest on record—as signs of overvaluation. While buybacks boosted by the Tax Cuts and Jobs Act helped earnings, history suggests substantial declines can follow high valuations, though the exact timing remains uncertain and CAPE is not a precise timing tool.
Tariffs are effectively a tax on U.S. consumption, potentially slowing growth by raising costs for consumers and firms. The S&P 500 is trading with a CAPE ratio above 39, a level historically followed by weak returns and drawdowns, a pattern echoing the dot-com crash. While earnings may accelerate in 2025–26, investors are advised to be cautious, consider preserving cash, and tilt portfolios toward long-term wealth rather than chasing volatility.
Despite a 14% gain in the S&P 500 over the past year, investors face risk as Trump’s tariffs loom and the CAPE ratio nears dot-com-era highs (around 39.9). History suggests such levels precede declines—about 4% next year and 20% over the following two years. Goldman Sachs says tariffs are largely paid by consumers, ISM manufacturing has contracted for 10 straight months, and jobs growth was modest last year. With potential EU retaliation and 13% of U.S. imports affected, investors should review portfolios, hold cash for dips, and remain wary even as AI optimism persists.
Warren Buffett's recent $184 billion net sales amid high market valuations and a historically expensive S&P 500 suggest a potential stock market decline in 2026, with historical data indicating possible drops of 4% on average and up to 30% over three years if current valuation levels persist.
The Cyclically Adjusted Price-to-Earnings (CAPE) ratio has risen to 40.5, nearing the all-time high of 44.1 before the Dot-Com Bubble burst, sparking concerns about overvaluation, but such readings are not reliable indicators of imminent market crashes as overvalued markets can remain so for extended periods.
The article discusses two historically reliable indicators, the Buffett indicator and the Shiller CAPE ratio, which are currently at high levels suggesting the possibility of a stock market decline around 2026. Investors are advised to be prepared for potential downturns while maintaining a long-term focus.
Federal Reserve Chair Jerome Powell's comments on high stock valuations are supported by several metrics, including the CAPE ratio, Buffett indicator, and price-to-sales ratio, all of which are near or at record highs, suggesting stocks may be fairly valued or overvalued.
The article warns that despite recent stock market highs driven by optimism and technological growth, historical patterns suggest that overvaluation, as indicated by the high CAPE ratio, and ongoing trade tensions with tariffs could lead to significant market declines, making current valuations a potential ticking time bomb for investors.
Famed economist David Rosenberg warns that the current high stock valuations, with the Shiller CAPE ratio at its third-highest level ever, suggest negative returns ahead and indicate a price bubble, especially as economic indicators like slowing job growth and rising unemployment claims point to a potential downturn.